Artificial intelligence calculates phase diagrams
Researchers at the University of Basel have developed a new method for calculating phase diagrams of physical systems that works similarly to ChatGPT. This artificial intelligence could even automate scientific experiments in the future.
A year and a half ago, ChatGPT was released, and ever since, there has been hardly anything that cannot be created with this new form of artificial intelligence: texts, images, videos, and even music. ChatGPT is based on so-called generative models, which, using a complex algorithm, can create something entirely new from known information.
A research team led by Professor Christoph Bruder at the University of Basel, together with colleagues at the Massachusetts Institute of Technology (MIT) in Boston, have now used a similar method to calculate phase diagrams of physical systems. They recently published their results in the scientific journal Physical Review Letters.
Phase diagrams are difficult to calculate
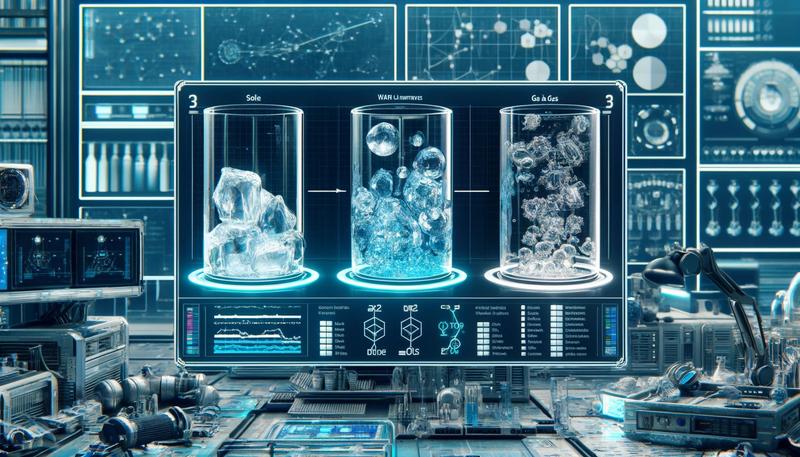
Phase diagrams are fundamental in physics. They describe the states in which a material can exist—water, for instance, can be found as ice, liquid, or vapor. Between these phases, phase transitions occur depending on specific quantities such as temperature or pressure. These transitions come in different kinds—for instance, they occur between a regular electric conductor and a superconductor or from a non-magnetic to a ferromagnetic state.
“However, calculating phase diagrams is difficult and requires a lot of prior knowledge and intuition on the part of the researchers,” says Julian Arnold, a PhD student in Bruder’s group. The problem is that a solid or a liquid consists of very many particles – atoms or molecules. These particles interact, meaning that they attract or repel each other; they form what is known as a many-body system. There are many possibilities for what the overall state of the material – characterized by the positions of the particles, but also additional properties, such as the orientation of the spins, which indicate the direction of magnetization – can look like.
“In the past, phase diagrams were often calculated by classifying these states with the help of neural networks,” Bruder explains. This works roughly like image recognition, where an algorithm tries to distinguish between images of cats and dogs. In this case, the algorithm calculates the likelihood that a particular image shows a cat or a dog and decides accordingly.
Faster thanks to generative models
As an alternative to this discriminative approach, the researchers in Basel and Boston have now developed a generative method. The difference is that in the generative method, which is similar to ChatGPT, the computer creates a large number of possible states of the system (in the above example, lots of cats and dogs) and decides which phase a particular state belongs to.
“We have shown that the generative method can calculate a phase diagram autonomously and in a much shorter time than the discriminative method”, says Arnold. Currently, he is testing the method on a model for black holes in the universe to detect their phase transitions. In the future, the new technique might even automatize physics laboratories: the algorithm would automatically set the control parameters of an experimental apparatus and immediately calculate a phase diagram from measured data.
Interestingly, the method for calculating phase diagrams inspired by ChatGPT can also be applied to models like ChatGPT itself. “ChatGPT also has something like a temperature,” Arnold explains. If this temperature is very low, the algorithm is not very creative and only produces expected results. If, on the other hand, it is too high, then the generated text becomes arbitrary and chaotic. Using the technique of the Basel researchers, one can determine the transition between these two phases and, based on that information, optimally tune language models.
Wissenschaftlicher Ansprechpartner:
Prof. Christoph Bruder, University of Basel, Department of Physics, tel. +41 61 207 36 92, email: christoph.bruder@unibas.ch
Originalpublikation:
Julian Arnold, Frank Schäfer, Alan Edelman, Christoph Bruder
Mapping out phase diagrams with generative classifiers
Physical Review Letters (2024), doi: 10.1103/PhysRevLett.132.207301
https://doi.org/10.1103/PhysRevLett.132.207301
Die semantisch ähnlichsten Pressemitteilungen im idw


